Graph diagrams
Graph diagrams documentation.
Every category with a graph reader also has a diagram action. It reads the
graph through that reader and draws it: as Mermaid text you can paste into a
pull request, a wiki or these docs, or as an image ue-mcp draws itself.
| Category | Action | Reads | Drawn as |
|---|---|---|---|
blueprint | diagram | read_graph_summary (plus each collapsed graph with expandCollapsed) | flowchart, exec wires solid, data wires dashed |
animation | diagram | read_state_machine and each transition's rule graph, or the AnimGraph, or a Control Rig | state diagram, or flowchart |
statetree | diagram | read | state diagram with nested states |
gameplay | diagram_behavior_tree | read_behavior_tree_graph | top-down flowchart from ROOT |
material | diagram | read_graph, every page | flowchart into the material output |
pcg | diagram | read_graph | flowchart from the input node to the output node |
asset | diagram | read_graph (any other EdGraph asset) | flowchart, one subgraph per graph |
The action is read-only: the editor sees an ordinary read, and the drawing happens in the ue-mcp process.
Formats
format picks the output.
mermaid(the default): Mermaid text in themermaidfield. A flowchart for exec and data graphs,stateDiagram-v2for state machines and StateTree.svg: an image file, laid out with a layered layout and drawn in the ue-mcp look. The result gives itspath,widthandheight.png: the same image rasterised. It comes back inline as image content, so a client that shows images shows the diagram in the conversation, and it is written to a file as well.json: the normalisedgraph(nodes, edges, groups) the other formats are drawn from.
Files go to [Project]/Saved/UE_MCP/Diagrams/ unless outputPath names one.
PNG uses the optional @resvg/resvg-js package; where it is not installed the
action writes the SVG and says so in pngUnavailable.
Large graphs
A drawing holds 80 nodes unless maxNodes says otherwise (up to 500). Nodes are
kept in order of distance from where the graph starts (its events, entry nodes
or initial state), and what is left out is named twice: a note node in the
drawing and a sentence in notes.
To draw a different part, pass focus with a node title, a node id or a state
name, and depth, the number of hops to follow from it in either direction
(default 3). Focusing a StateTree parent state draws all of its children.
On a Blueprint, edges: "exec" with focus on an event traces that event's
execution flow.
Examples
A Blueprint event graph with its collapsed graph expanded beside it:
{ "action": "diagram", "assetPath": "/Game/Blueprints/BP_Door", "expandCollapsed": true, "format": "png" }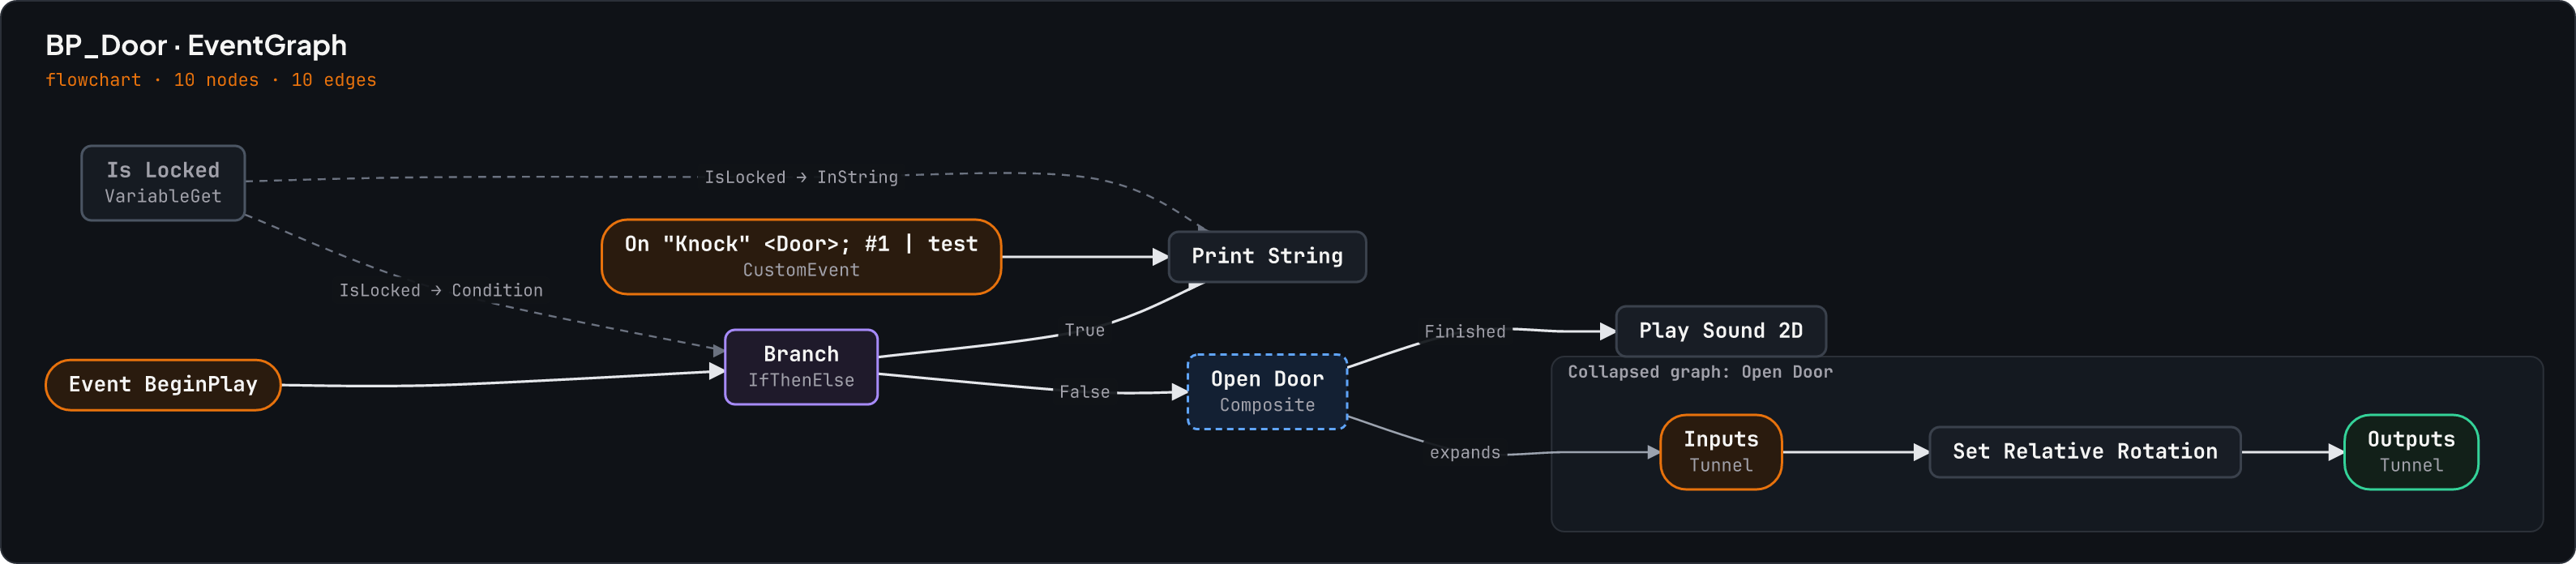
A StateTree, its parent states drawn as boxes entered through their first child, and each transition labelled with its trigger, event tag, conditions and delay:
{ "action": "diagram", "assetPath": "/Game/AI/ST_Guard", "format": "png" }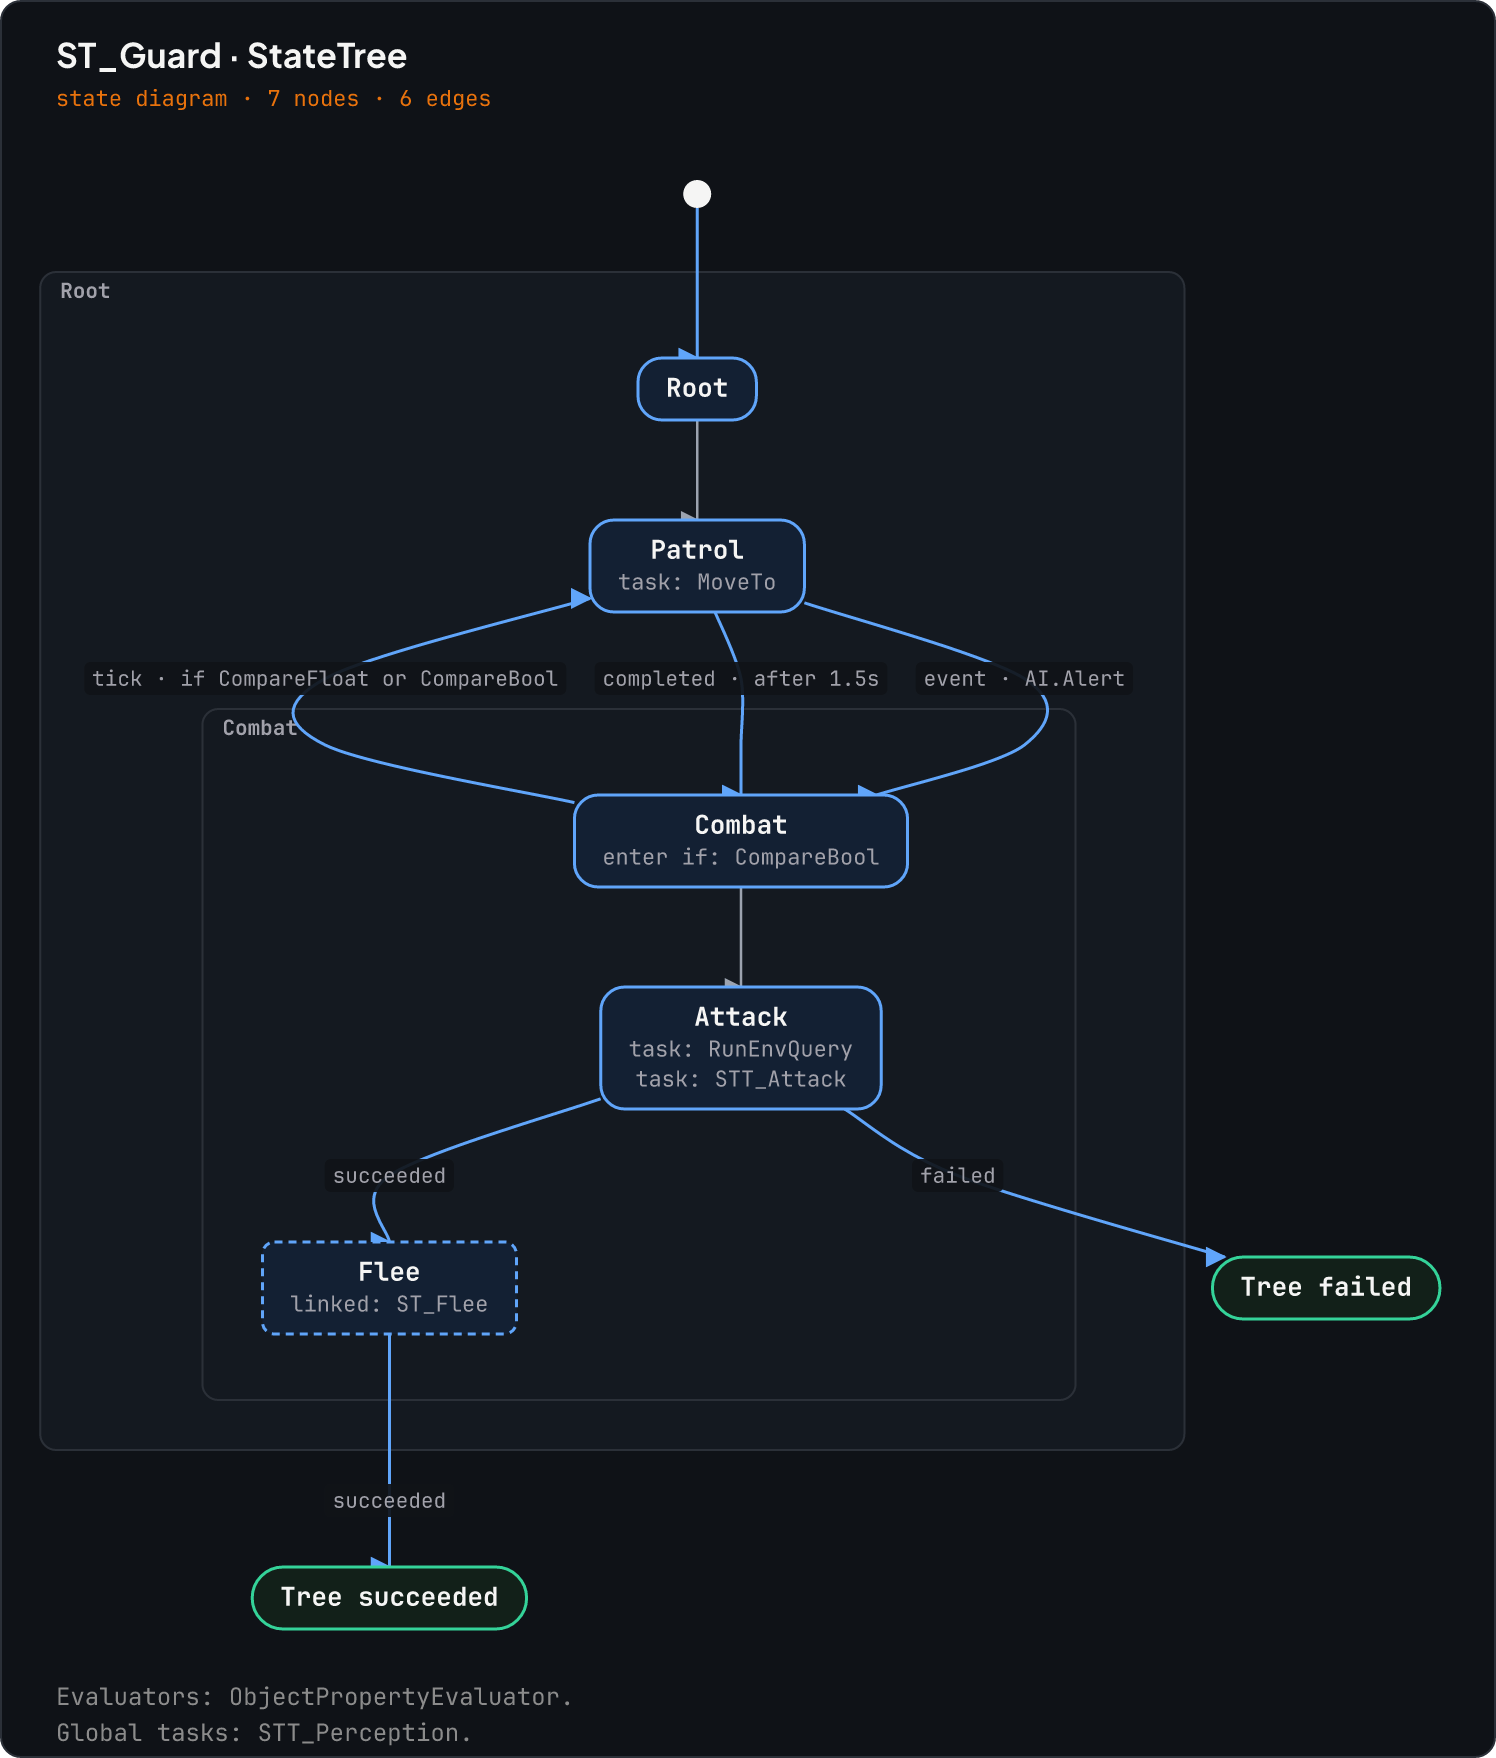
A PCG graph as Mermaid:
{ "action": "diagram", "assetPath": "/Game/PCG/PCG_Forest" }Mermaid details
- Node ids come from the reader's own ids (node GUIDs, PCG node names, StateTree state ids), so the same graph read twice gives the same text and two versions diff cleanly.
- Every label is quoted, and the characters Mermaid reads as syntax (
",#,;,<,>,|,&, backticks and braces) are written as entity codes. - Collapsed graphs, extra function graphs, StateTree parent states and multiple asset graphs become subgraphs or composite states.
- Wires and transitions carry labels: the pin names a wire joins (default pins
such as
thenandReturnValueare left out), and a transition's rule, blend time, trigger, event or conditions. - Each node role gets a class (
ue_entry,ue_branch,ue_state, ...) styled with the ue-mcp colours.